Reimagine
data visualization
Reimagine
data visualization
Transform your IoT data into actionable insights.
Use akenza's intuitive Dashboard Builder.
Transform your IoT data into actionable insights. Use akenza's intuitive Dashboard Builder.
Build it. Customize it. Share it.
Build it. Customize it. Share it.


Build any dashboard you need.
We have configurable components.
Build any dashboard you need with our configurable components
Build any dashboard you need.
We have configurable components.
Image


Floorplan


Map


Chart


Input


Floorplan


Image


Map


Chart


Input


Status


Table


Trend


Performance


Slider


Gauge


Group


Text


Button


Switch


Status


Table


Trend


Performance


Slider


Gauge


Group


Text


Button


Switch


Turn your office into a data powerhouse
Turn your office into a data powerhouse
Turn your office into a data powerhouse
Stop hiding data in back-office tools.
See and show your space in use.
Stop hiding data in back-office tools. Show how your space is really used and put insights where they matter.
Stop hiding data in back-office tools. Show how your space is really used and put insights where they matter.
Stop hiding data in back-office tools. Show how your space is really used and put insights where they matter.
Signage Screen
Signage Screen
Signage Screen
Push key metrics and room info to big screens. It's visible, clear and always up to date.
Push key metrics and room info to big screens. It's visible, clear and always up to date.
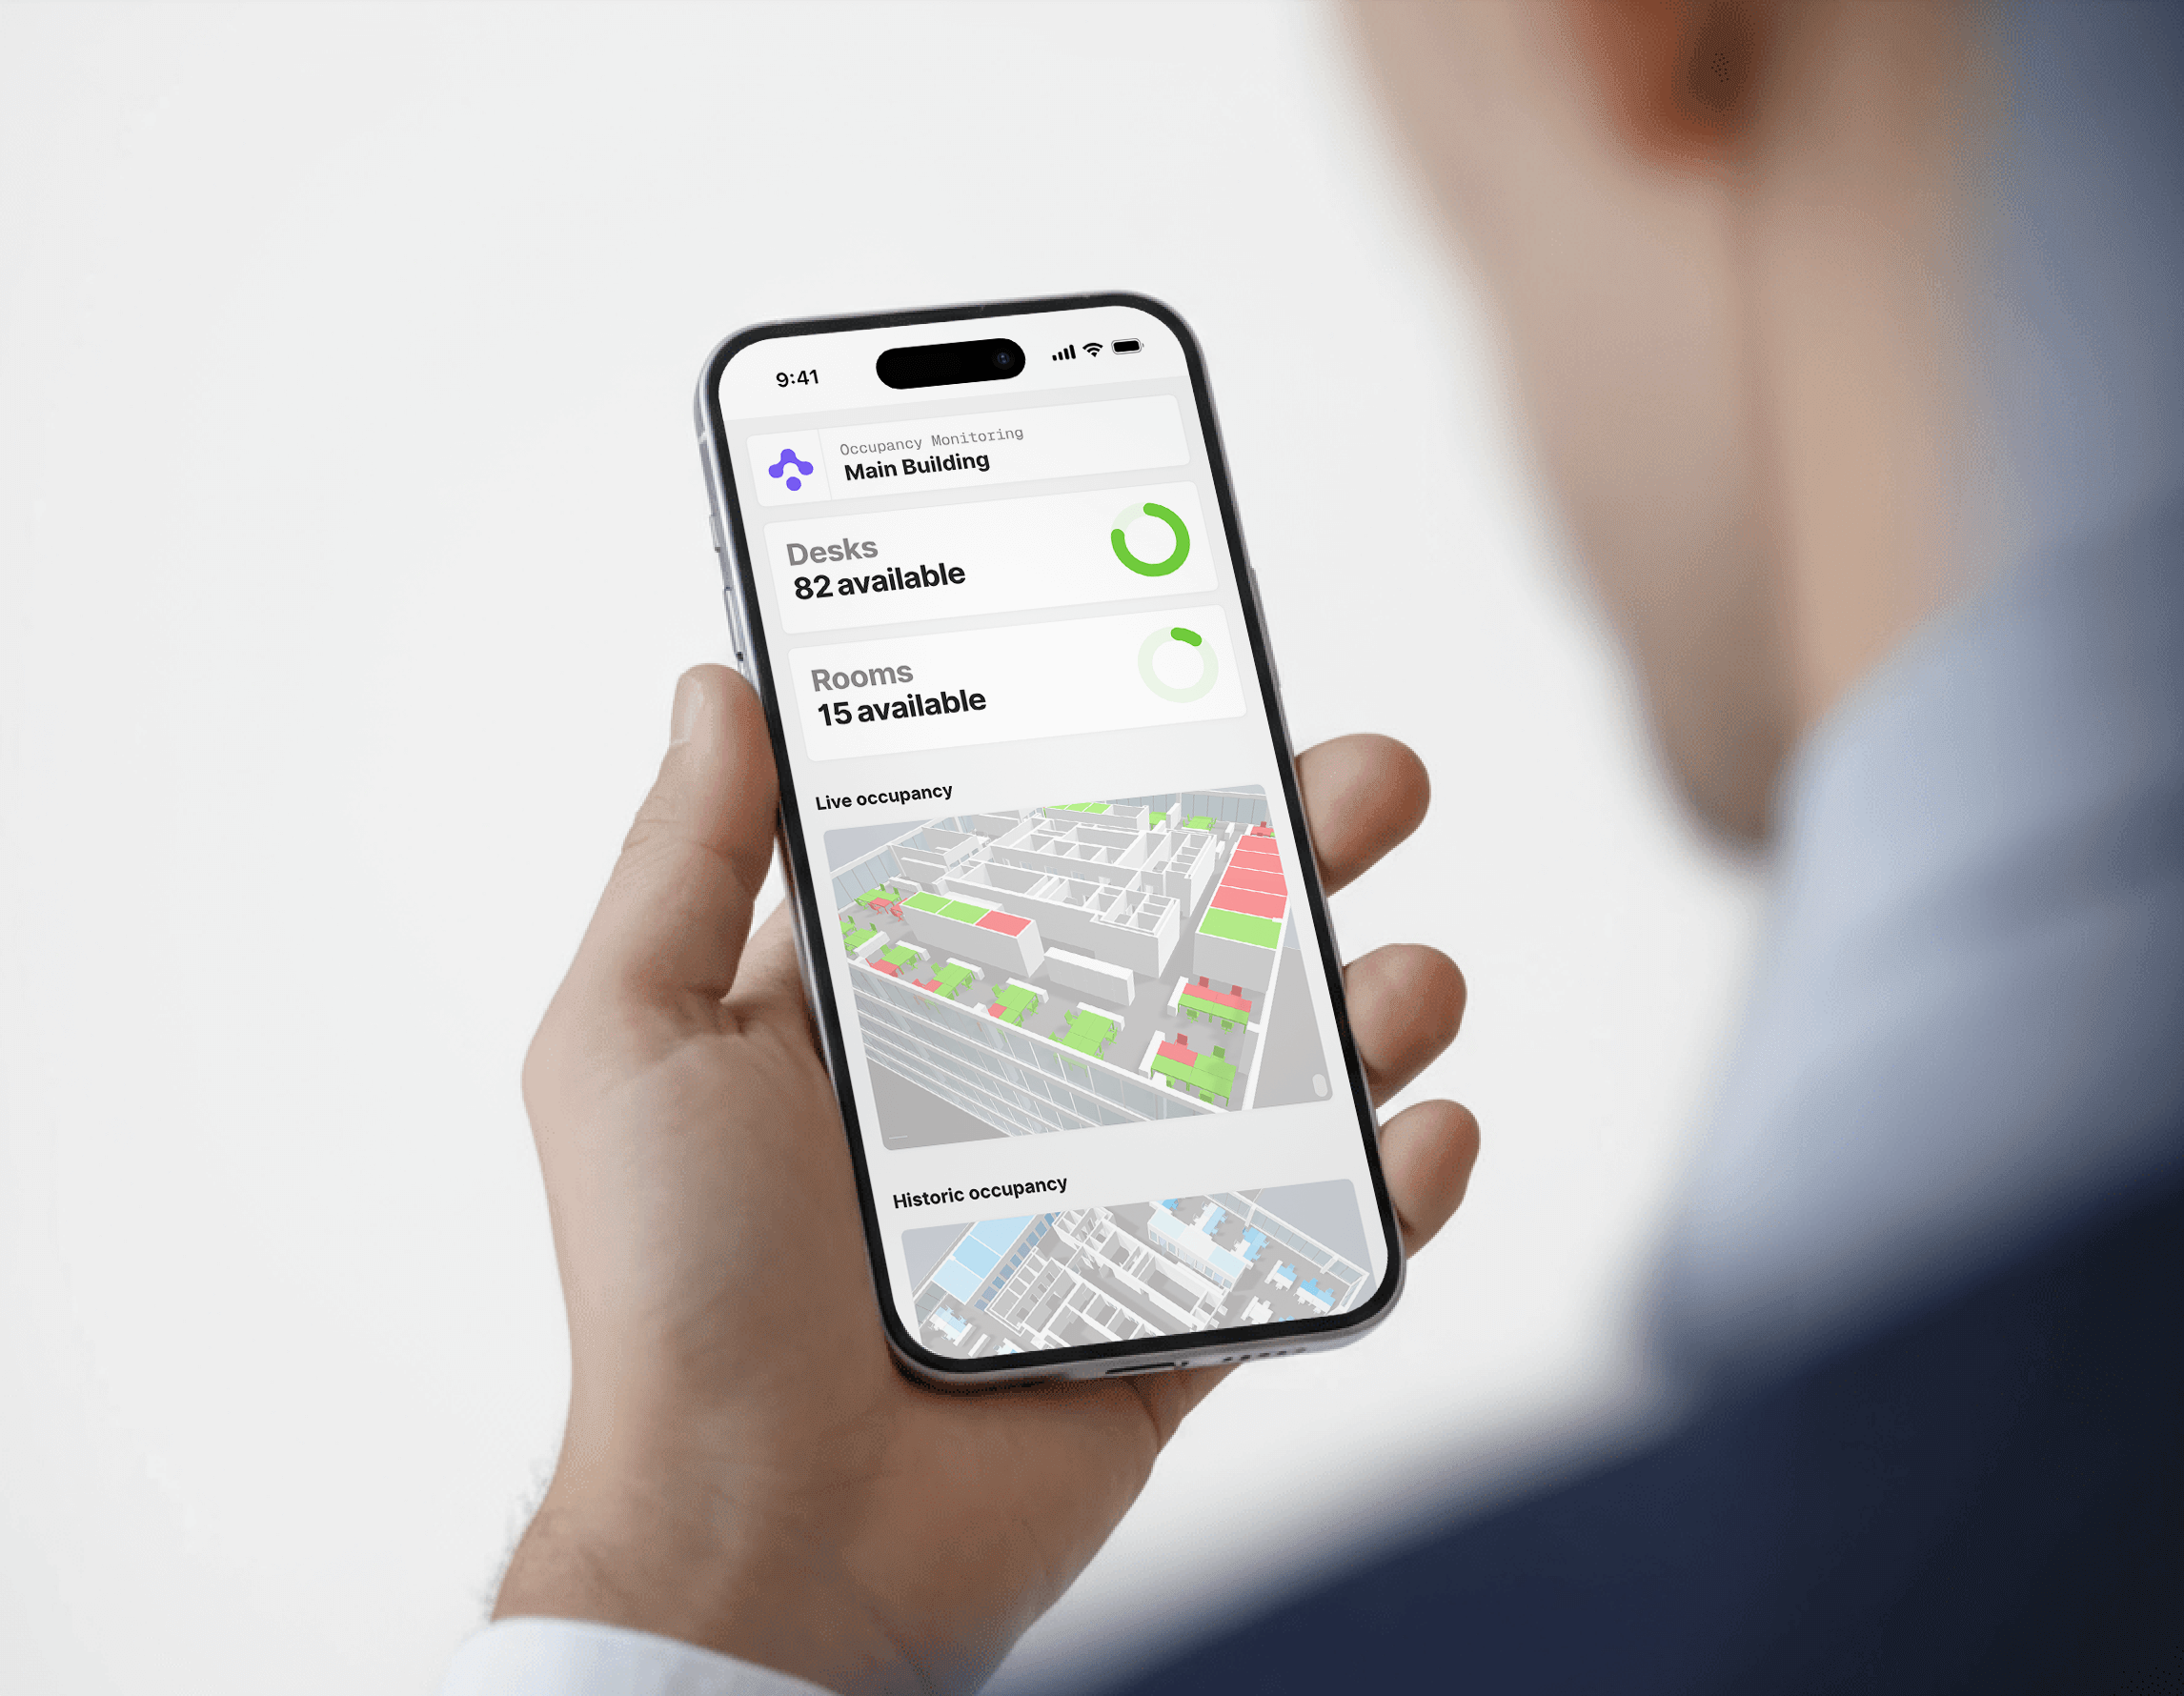
3D Digital Twin
3D Digital Twin
3D Digital Twin
Track occupancy, comfort, and usage patterns in a living 3D model of your building.
Track occupancy, comfort, and usage patterns in a living 3D model of your building.
Track occupancy, comfort, and usage patterns in a living 3D model of your building.


Tame the chaos of production data
Tame the chaos of production data
Tame the chaos of production data
Industrial data is overwhelming. Our dashboards cut through the noise so teams can act fast and with confidence.
Image component
Forget spreadsheets. Overlay live sensor values directly on machines and spot issues instantly.
Advanced charting
Basic charts don’t cut it. Uncover trends, anomalies, and correlations - even in millions of datapoints.
We have ready-made templates.
Choose a use case and get started.
Get started with ready-made use-case specific templates
All you need to build
a custom dashboard
All you need to build
a custom dashboard
All you need to build
a custom dashboard
Mobile optimized
Works on screens of all sizes.
Works on screens of all sizes.


External sharing
Securely share dashboards with anyone. No login required.
Securely share dashboards with anyone. No login required.
New Dashboard
Please review the new Dashboard here:
Overview Floor 2
Dynamic data sources
Select devices manually or query them by tags.
Select devices manually or query them by tags.
Comfort sensor
Comfort sensor
Humidity
Humidity
Headquarters
Headquarters
Moodbox
Moodbox
CO2
CO2
DL-IAM
DL-IAM
Zone 35
Zone 35
Brightness
Brightness
EMS Desk
EMS Desk
Customizable thresholds
Set thresholds to flag issues instantly.
Set thresholds to flag issues instantly.


White labeling
Brand dashboards with your custom logos and colors.
Brand dashboards with your custom logos and colors.


Why wait?
Try it now.
Why wait?
Try it now.
Why wait?
Try it now.


