
Product update
This is the best way to calculate occupancy
Julie Sylvest

Imagine reviewing your monthly facility dashboard and seeing a reassuring 75% average occupancy rate. On paper, your office portfolio has a healthy 25% buffer, suggesting ample room for growth.
Then the complaints start rolling in. The department head reports that their teams can’t find available seats, meeting rooms are double-booked, and floors are feeling jammed during peak mid-week hours.
As a facility manager, this disconnect is a nightmare. How can portfolio analytics report plenty of spare capacity when the reality points to a building under stress?
The answer lies in how traditional workplace analytics aggregate occupancy data.
The role of time-based occupancy
Facility management dashboards have relied on time-based occupancy tracking. Here’s the math behind it:
A sensor monitors a single desk over an 8-hour shift. It calculates the percentage of time that desk was occupied (e.g., 6 hours occupied = 75% time-based occupancy). The dashboard averages those individual desk percentages across an entire floor or building.Time-based calculation: [Desk A Avg % + Desk B Avg % + Desk C Avg % + Desk D Avg %] ÷ Total Desks
A 75% average time-based occupancy rate tells facility teams how efficiently a floor is utilized over a full day, week, or month.
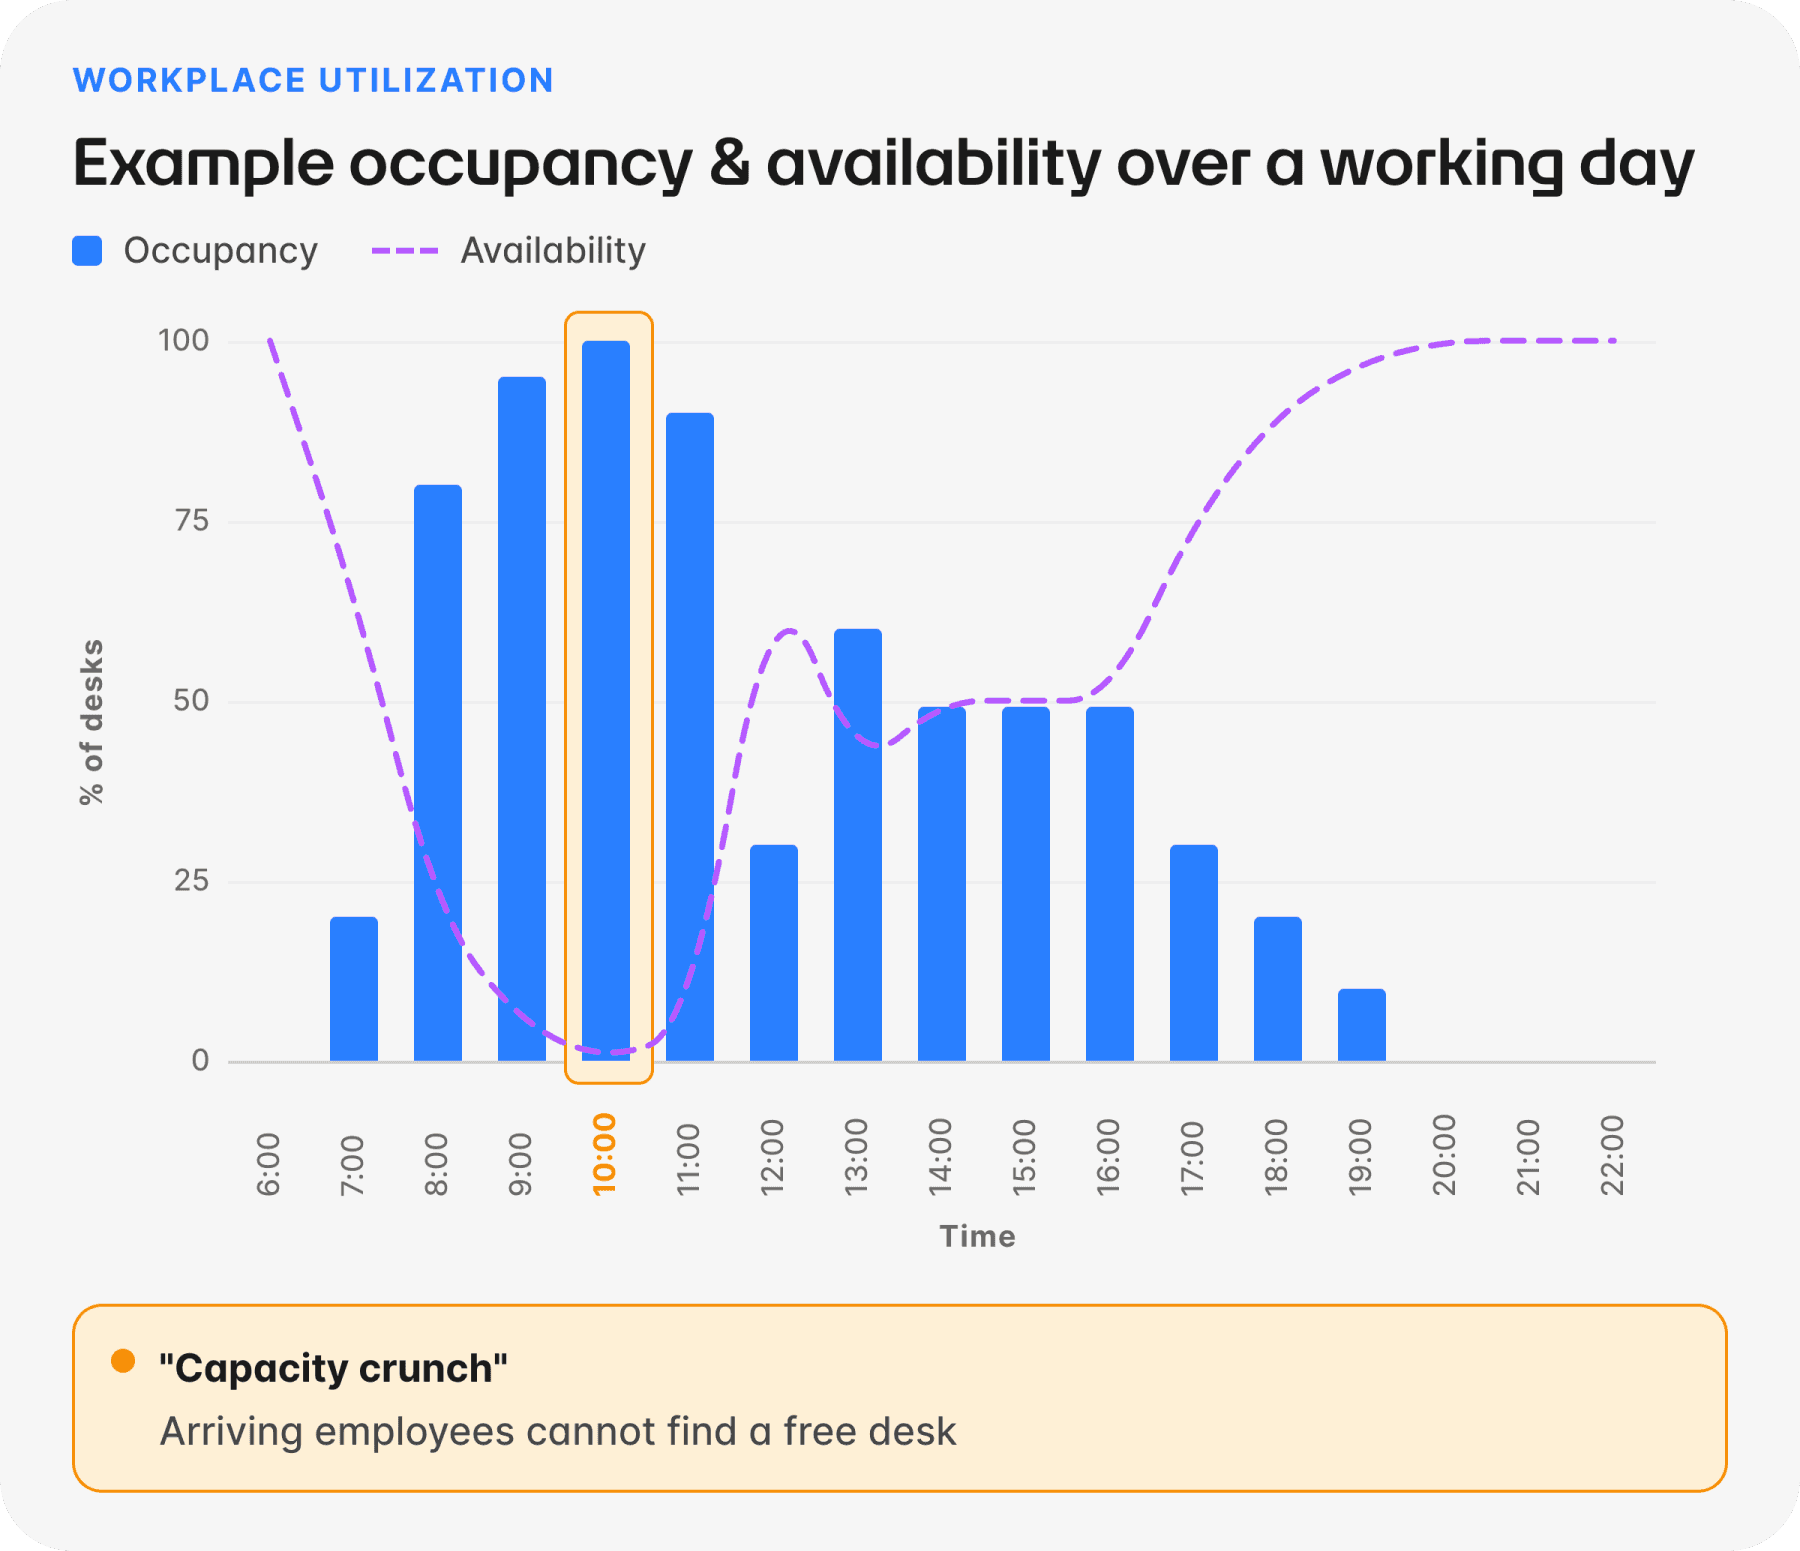
However, average numbers hide peak demand. That remaining 25% buffer can be spread across quiet hours, such as early mornings, late afternoons, or brief gaps between meetings. Because an empty desk at 7:30 AM cannot absorb seating demand during a mid-morning peak, time-based occupancy isn’t designed to show momentary capacity limits.
Concurrent occupancy surfaces the worst-case reality
To solve peak crowding and make confident space allocation decisions, facility teams also look at concurrent occupancy.
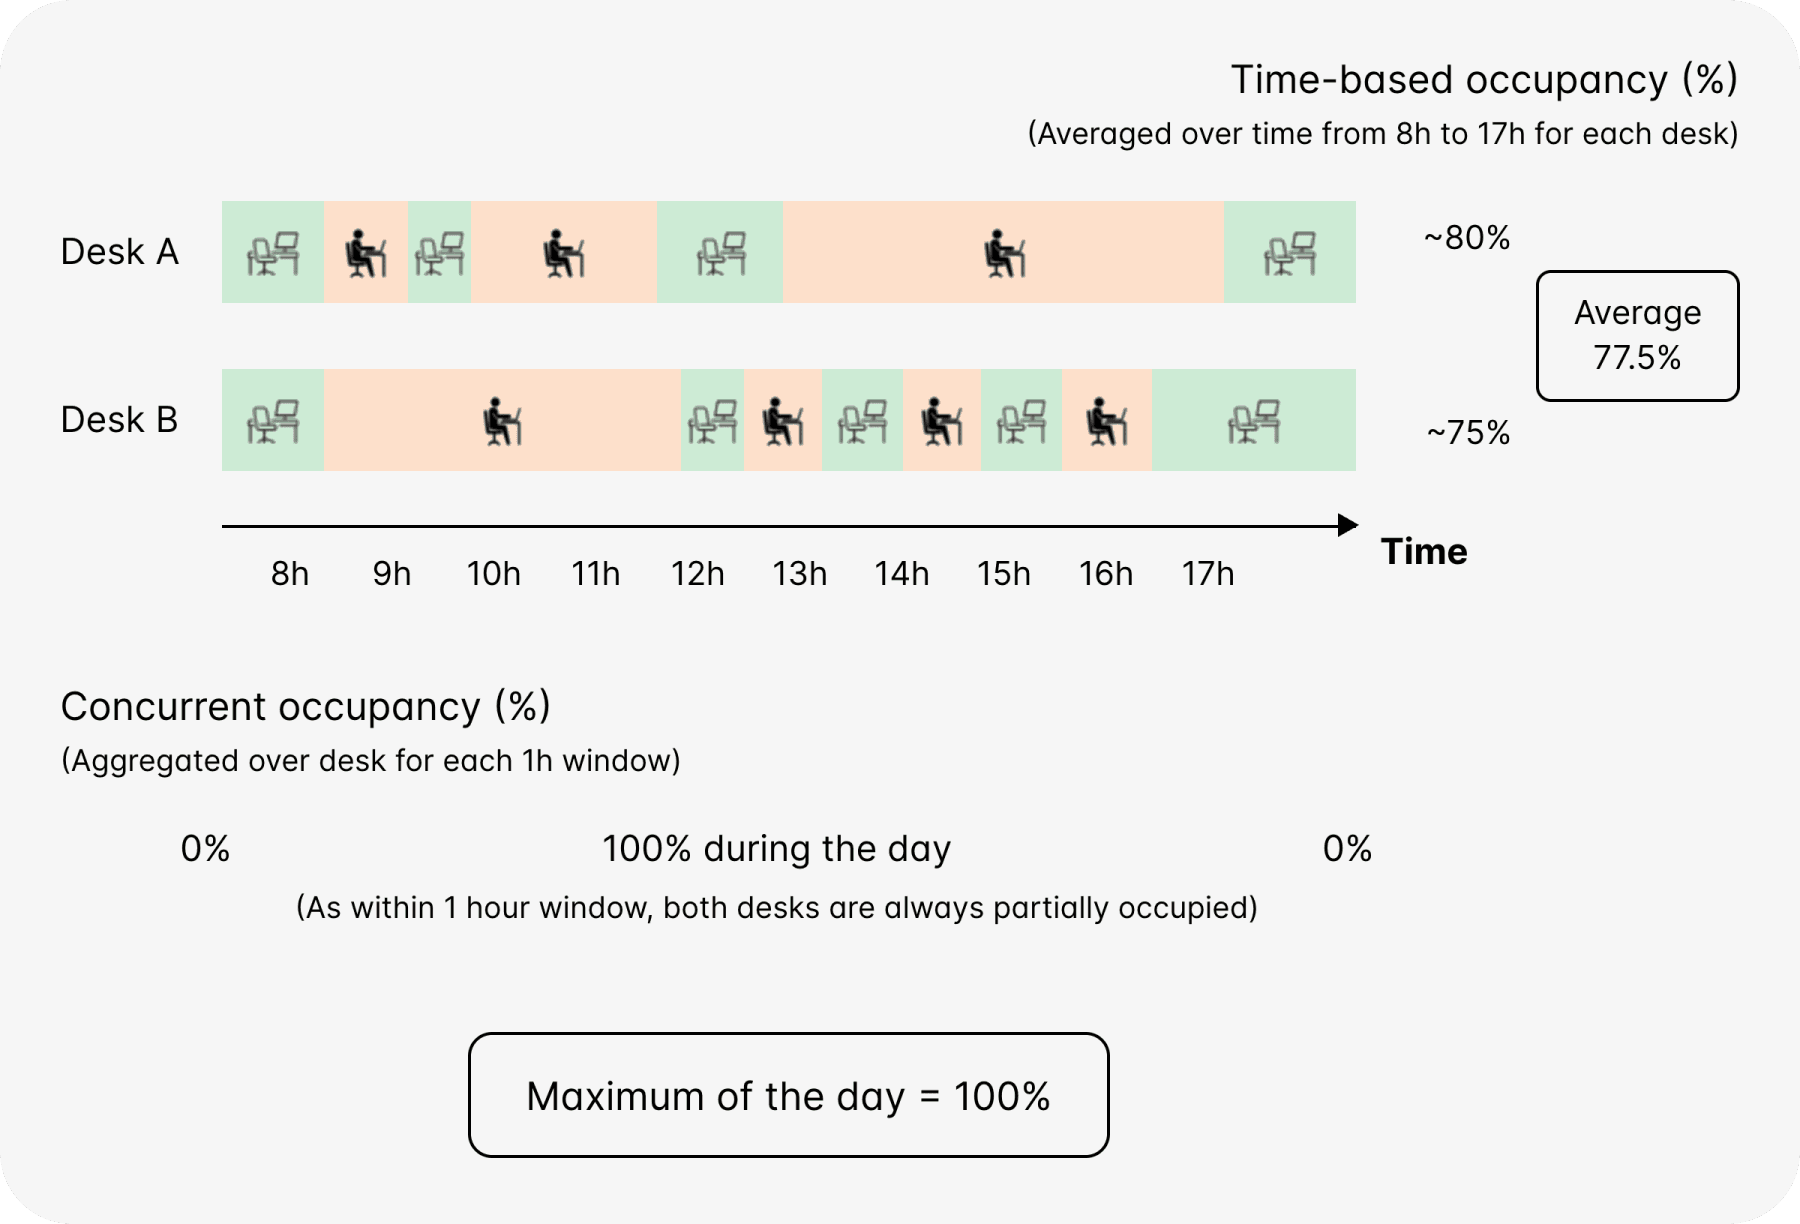
While time-based occupancy evaluates a single desk’s usage over time, concurrent occupancy measures every desk at a single point in time to identify the daily peak.
Concurrent calculation:
1. At 10:00 AM: Sum all occupied desks simultaneously.
2. At 11:00 AM: Sum all occupied desks simultaneously.
Occupancy = The MAXIMUM count observed during the day.
If every desk in a zone is occupied at 11:00 AM, the concurrent occupancy reaches 100%. Even if those same desks sit vacant for the rest of the day, concurrent occupancy highlights that at peak demand, that floor ran out of capacity.
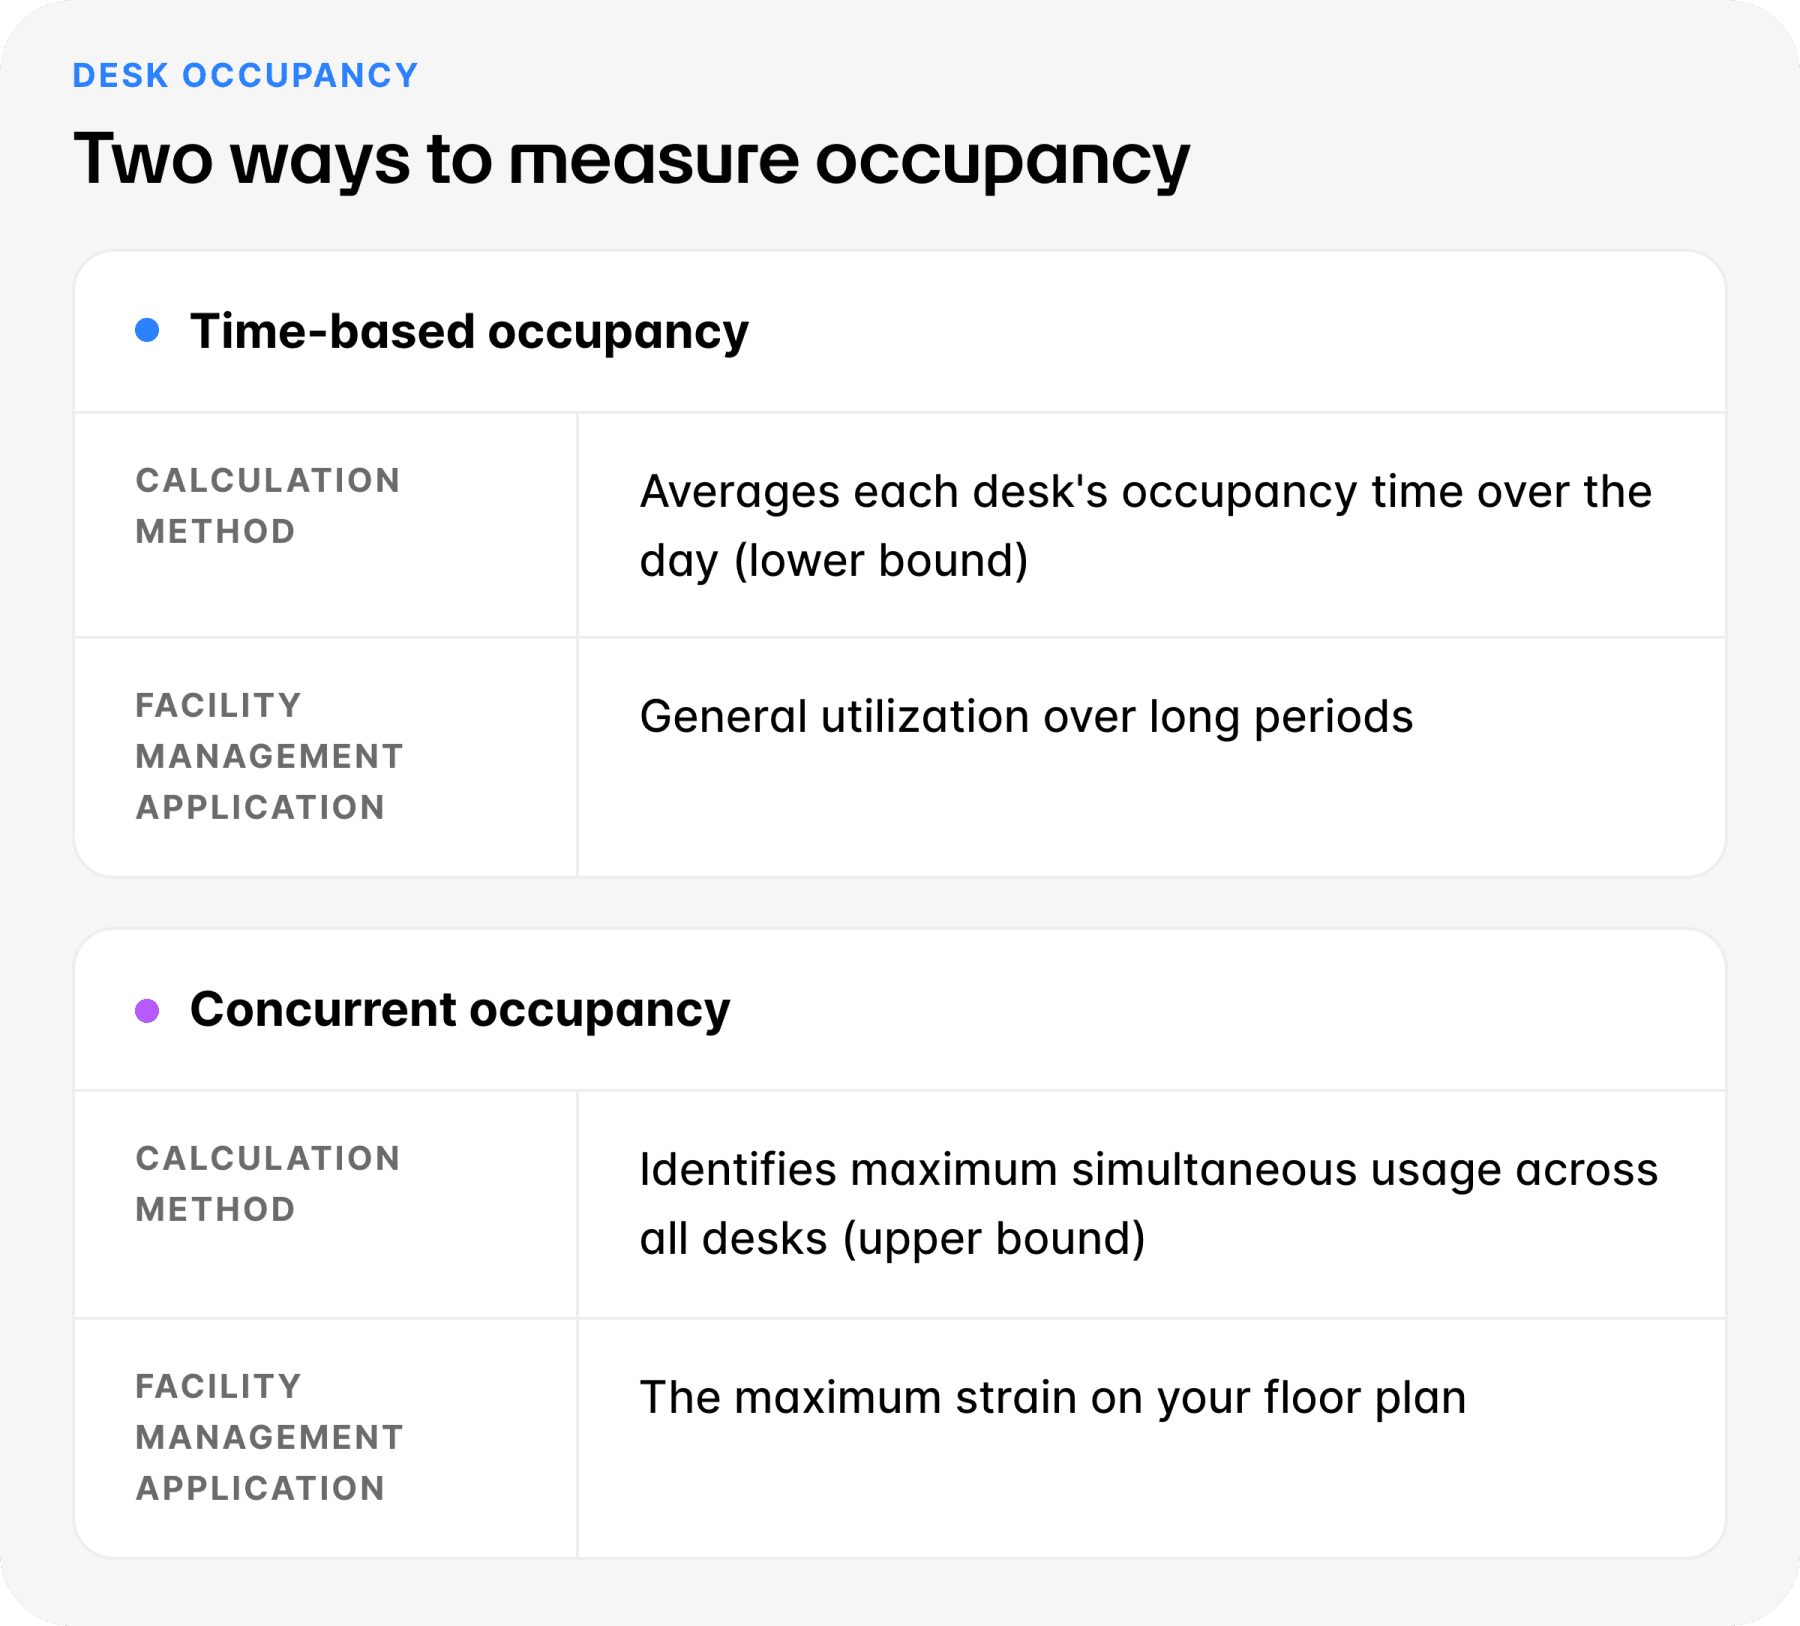
Both metrics tell a story. But they’re describing two different realities:
So, which occupancy calculation should you use?
Relying on time-based occupancy alone doesn’t give you a bad answer. It just tells you how much your space is used over time, but not how hard it gets hit during peak demand.
By leading with concurrent occupancy for space decisions, you ensure your space strategy is built to handle peak-hour demand.
Dive deeper into time-based and concurrent occupancy in our docs.
Explore occupancy monitoring with akenza.
Discover more blog posts


Need help with your IoT project?
To learn more about how akenza can help you build smart solutions with ease, contact us or directly sign up for a free trial today.
Changelog
If you want to follow the latest updates and upcoming features of akenza in real-time, be sure to check our changelog.