Jul 8, 2025
Let visuals do the talking with the image component
Julie Sylvest
Sometimes, numbers alone don’t tell the whole story.
The new image component lets you integrate visuals into your dashboards to paint the bigger picture.
View real-time data on an image
The image component lets you pin data directly onto the spaces and assets you’re monitoring. Whether you’re tracking equipment in an industrial environment or occupancy in an office, this component adds powerful visual context to your data.
It supports both pixel-based images like JPEG and PNG, as well as scalable vector graphics (SVG), giving you flexibility to choose the format that best fits your needs. Plus, with a variety of marker styles and sizes, you can customize your visuals to highlight key insights to suit your specific use case.
The range of use cases is limitless, from monitoring equipment health and energy usage on a factory floor to tracking space utilization and occupancy trends in offices. By tying data to physical spaces and assets, the image component makes it easier to understand what’s happening across your operations.

Upload an image of your floorplan and pin occupancy data directly to desks and rooms.
View your spaces from zoomed in to zoomed out
You can now embed photos of your equipment, rooms, or entire facilities directly into your dashboards, and place interactive markers anywhere on the image to highlight key data points or sensor readings. This lets you focus on a specific asset or zoom out to see how all machines function together across the entire facility.
This helps you understand operations at every level.

Support your dashboard’s story with any image
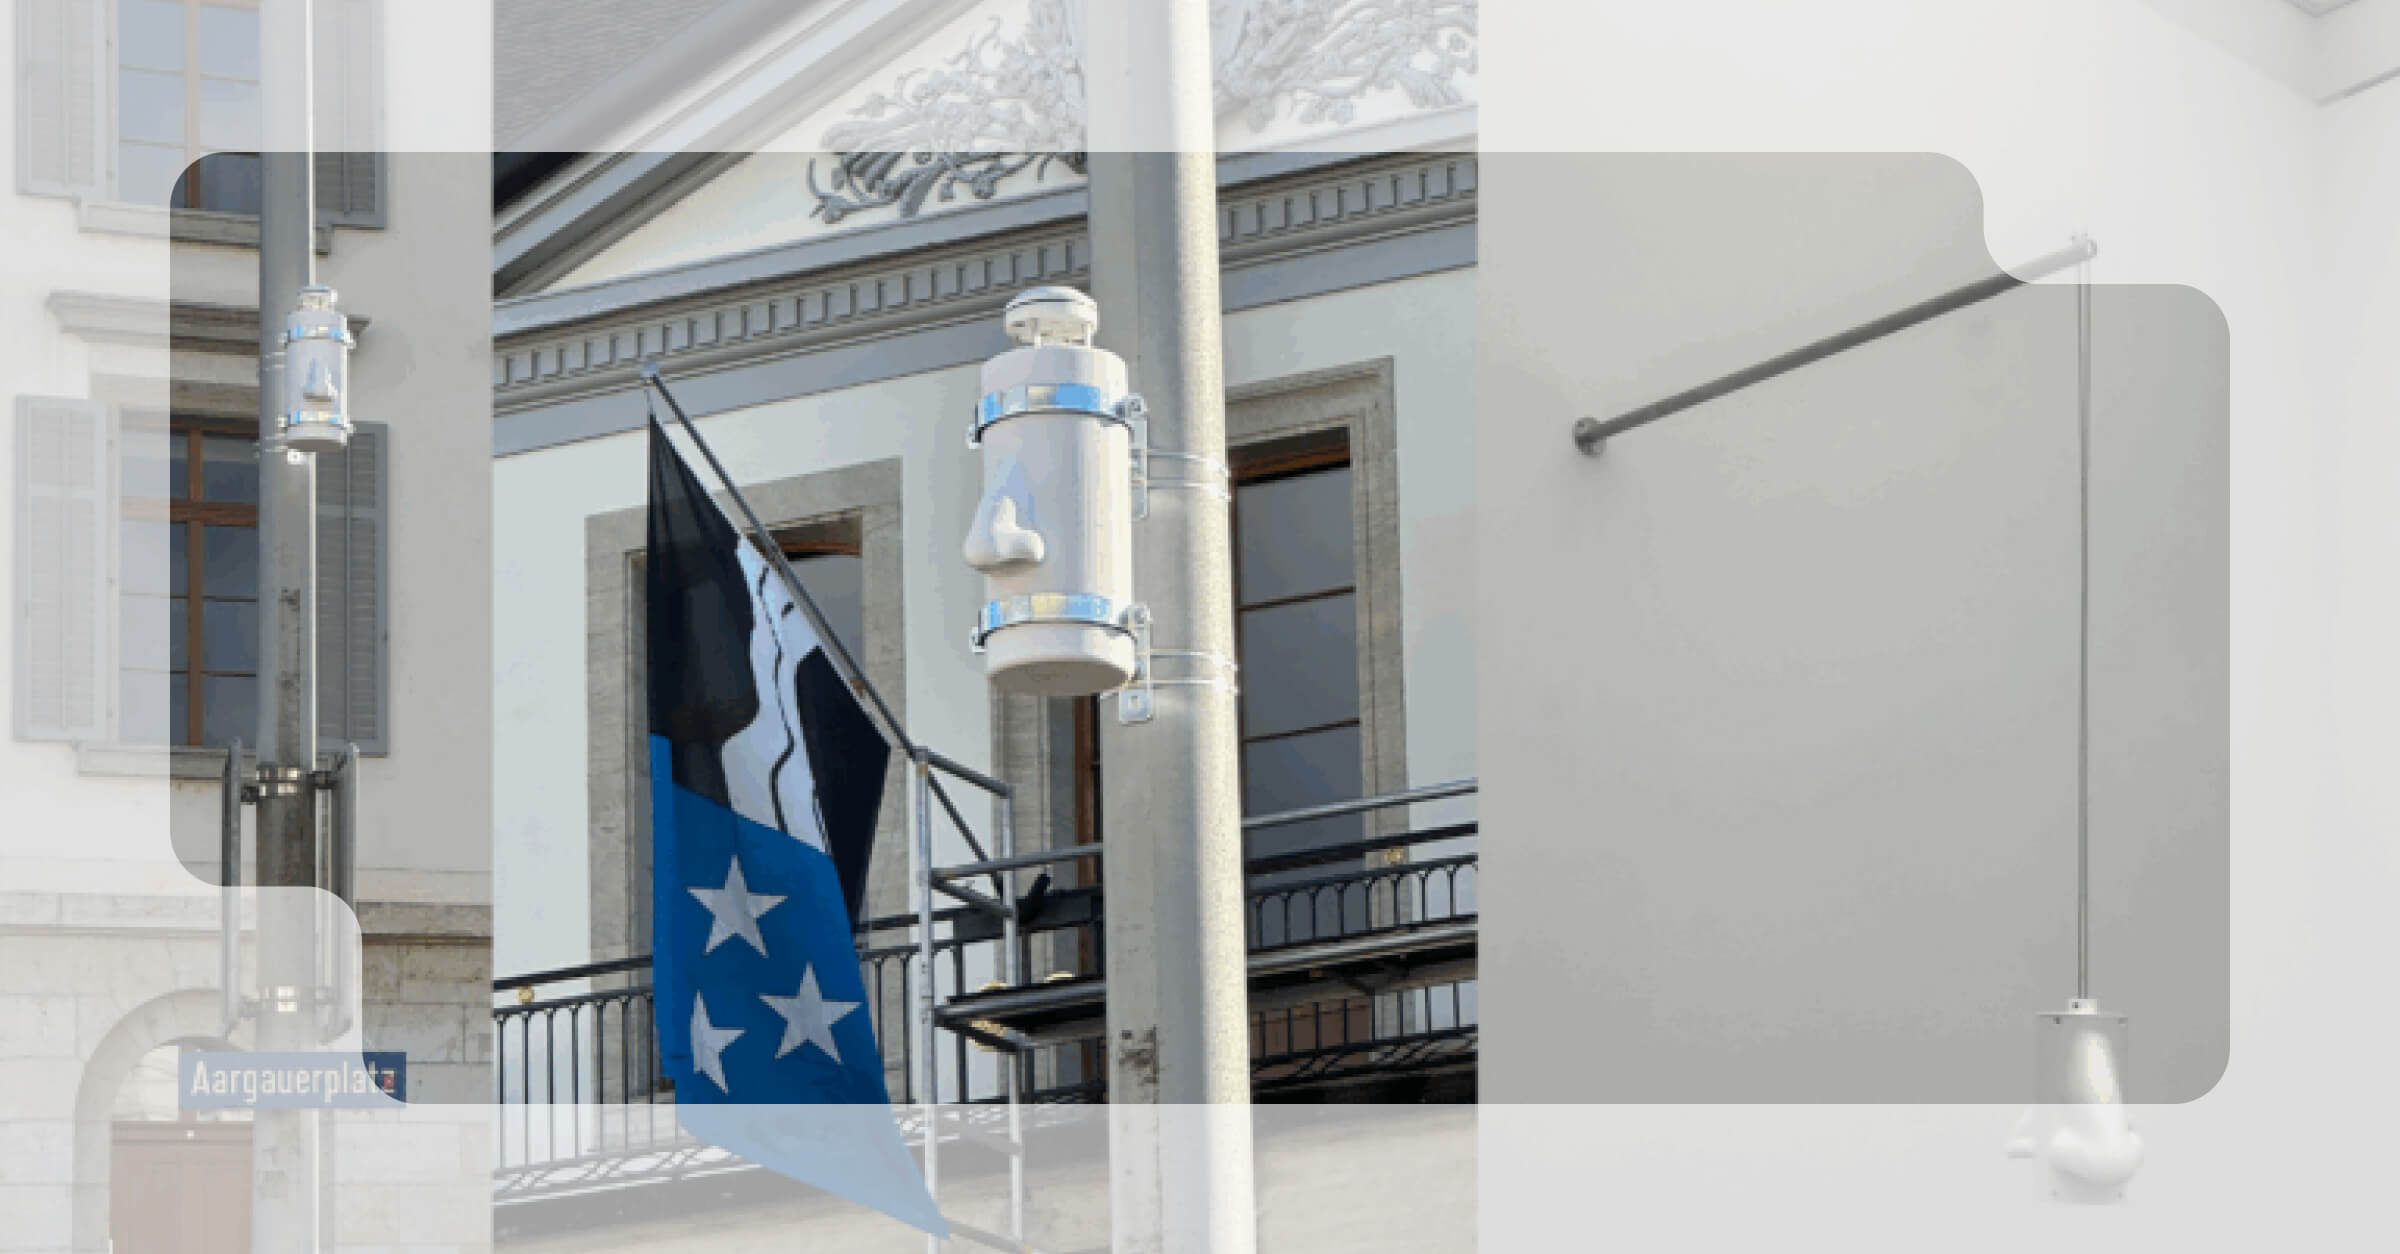
The image component supports uploading any mood or site image to your dashboard, even without adding data annotations. This is especially helpful for providing visual context alongside your sensor data. The image could show a location in your facility, a specific sensor used in the project, or even a conceptual diagram to help tell the bigger story.

Try it out on our Dashboard Builder with our 30-day free trial.
Stay up-to-date with the latest features at akenza on our Changelog.
Discover other blog posts
Need help with your IoT project?
To learn more about how akenza can help you build smart solutions with ease, contact us or directly sign up for a free trial today.
Changelog
If you want to follow the latest updates and upcoming features of akenza in real-time, be sure to check our changelog.


