Jul 8, 2024
Monitoring a green oasis with IoT in Zurich
Julie Sylvest
The Zurich city council launched a project to transform the historic Papierwerd area. Located between the main train station and the Limmatquai, Papierwerd derives its name from a paper mill that operated there for 500 years. The area, which has been a temporary host to the Globus provisional since 1961, is undergoing a significant makeover. This project aims to replace the existing parking spaces with greenery to create an urban sanctuary.

The Papierwerd is situated next to the Limmat

The provisional before the redesign. Photo courtesy of the city of Zurich
The benefits of this transformation
The reinvention of Papierwerd promises many advantages for the city, its residents, and visitors.
Expanding public space offers a recreational area to enjoy views of the Limmat. Enhanced green infrastructure not only improves aesthetics but also promotes environmental sustainability. The new greenery will provide shade, reduce urban heat, and improve air quality.

The new space overlooking the Limmat. Photo courtesy of the city of Zurich
Monitoring the green oasis with akenza
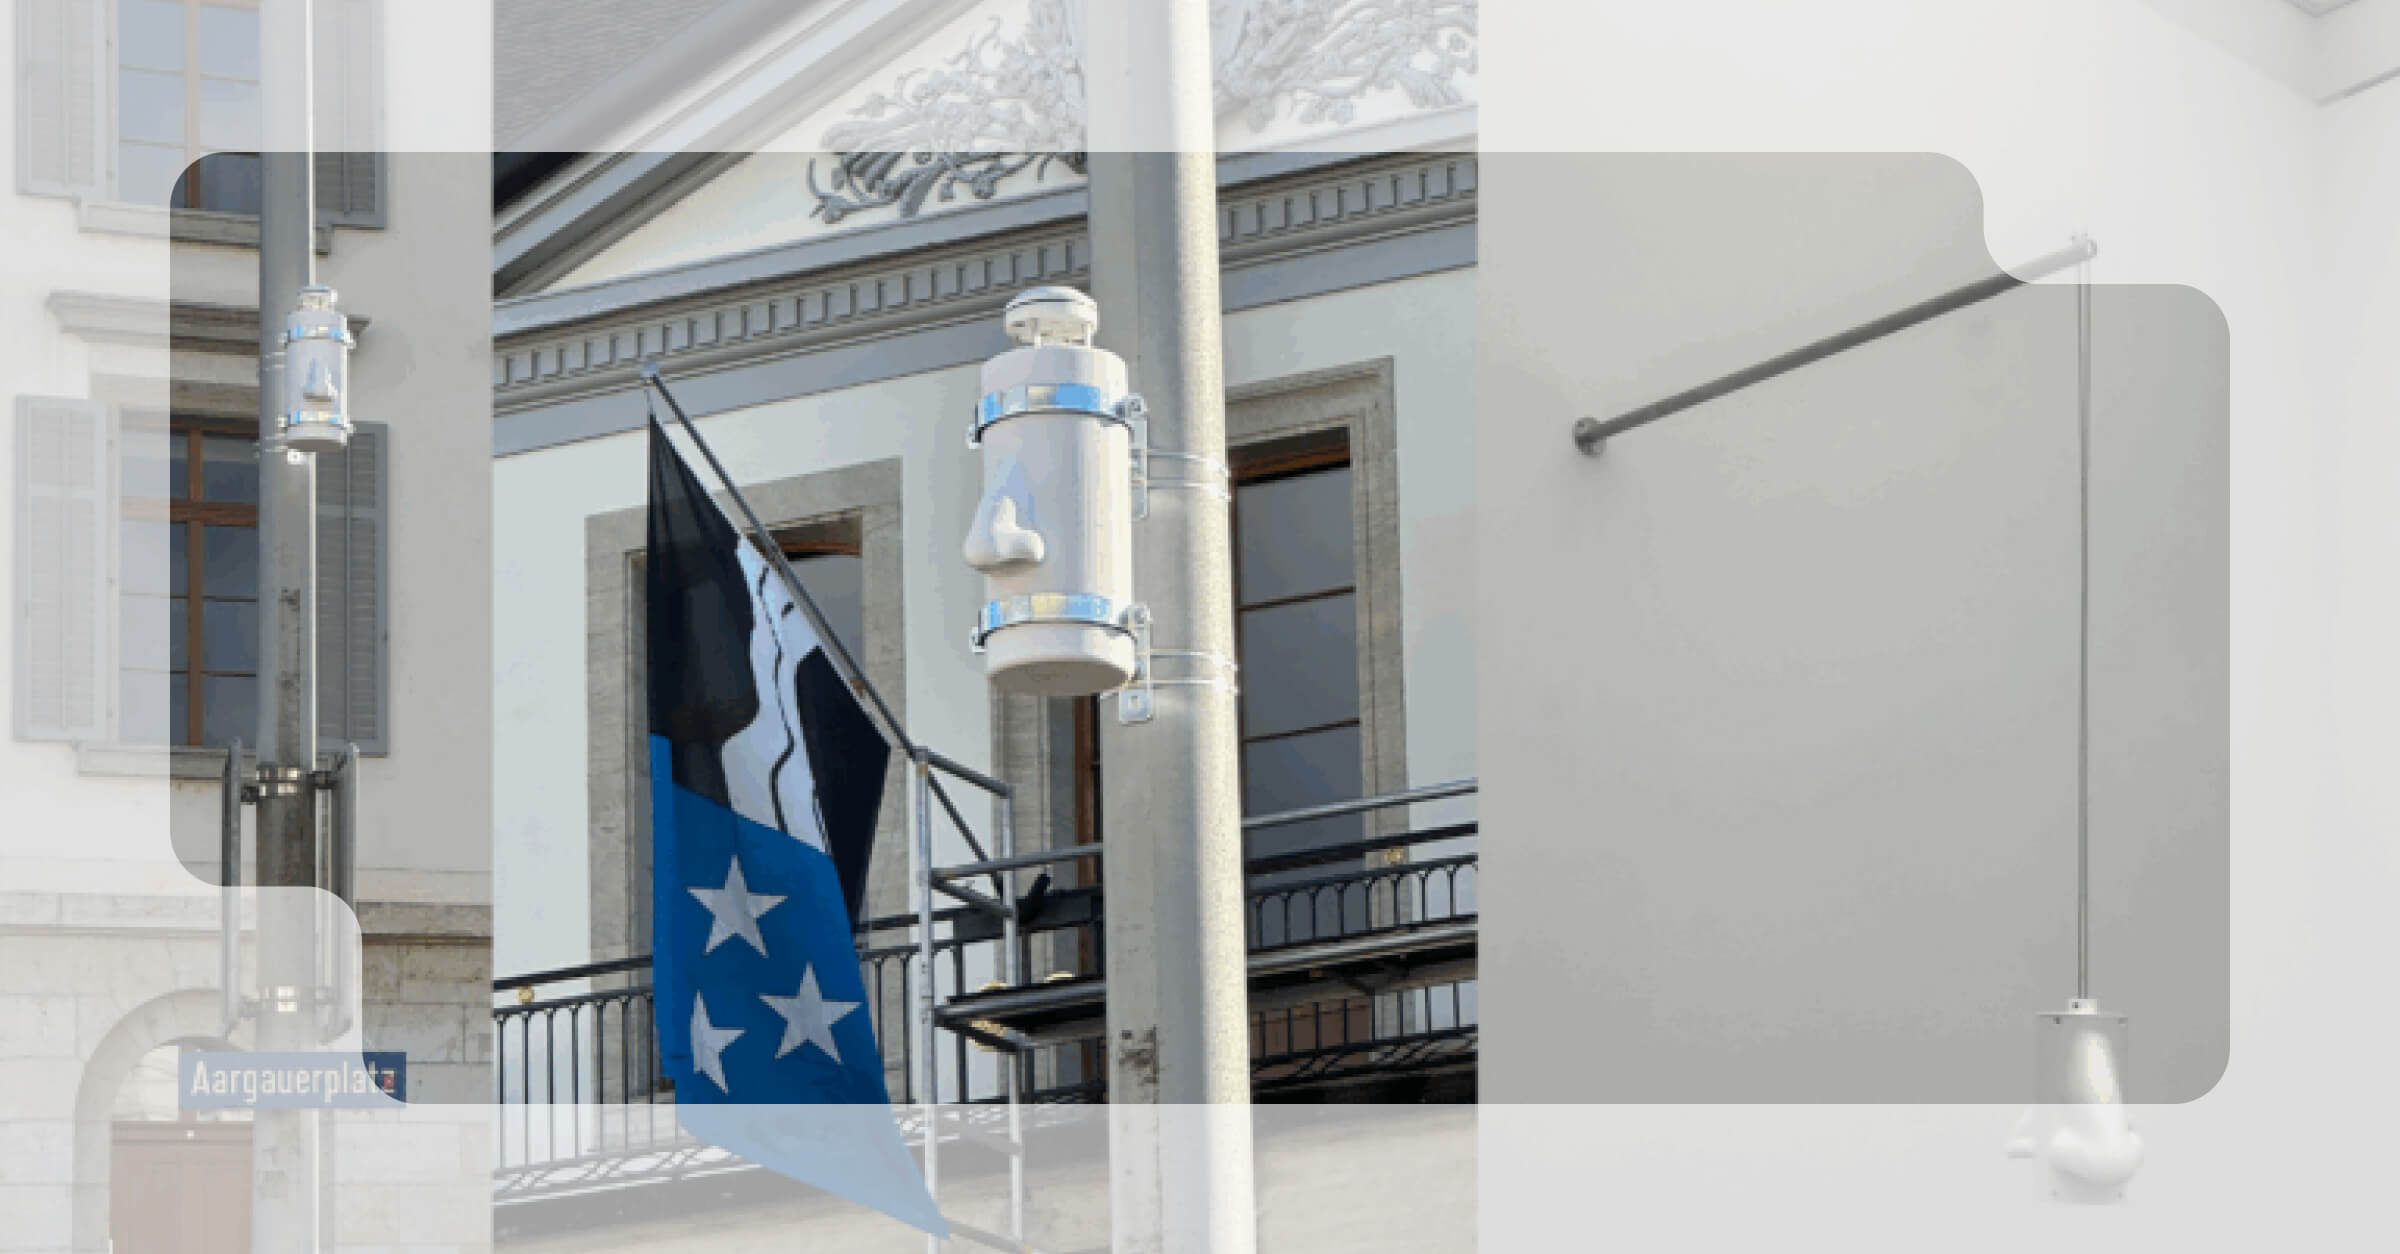
To evaluate the environmental impact of this project, planikum, with its expertise in landscape architecture and environmental planning, uses the akenza IoT platform. Tree air pots provide immediate shade and cooling; transplanting them later will provide continued benefits. These pots and the surroundings are equipped with LoRaWAN soil moisture and climate sensors to measure key metrics.
The Seeed SenseCAP S2105 sensors are placed in the air pots and measure soil moisture and temperature. The Milesight EM300-TH sensors monitor temperature and humidity in the encompassing space. These devices send real-time metrics to the akenza platform via the ewz LoRaWAN network.

The installation of a Seeed SenseCAP S2105 sensor in an air pot

An air pot looking over the Limmat
“The akenza platform allows us to connect our monitoring sensors to the cloud and collect measurement data. This enables us to concentrate on interpreting the data for informed decision-making.”
- Morris Mueller, Landscape Architect at planikum
planikum can assess the project’s impact over time by analyzing sensor data on akenza. The akenza Dashboard Builder displays real-time and historical data on graphs, charts, and KPI components. These visualizations enable continuous monitoring and management of conditions. This data supports identifying trends and anomalies, making informed decisions, and ensuring the sustainability of this new urban sanctuary.

The akenza Dashboard Builder displaying soil temperature and humidity data
A leading example in urban innovation
The Papierwerd project exemplifies the power of IoT technology in monitoring and preserving natural ecosystems. Many other EU cities, including Amsterdam, Barcelona, and London, have launched initiatives to combat urban heat islands and promote sustainable urban development. For example, the Paris Smart City 2050 initiative has introduced eight energy-plus tower prototypes aimed to reduce greenhouse gas emissions.
We look forward to witnessing the progress, development, and positive impact of the Papierwerd project as it advances urban innovation in Zurich.
Discover other blog posts
Need help with your IoT project?
To learn more about how akenza can help you build smart solutions with ease, contact us or directly sign up for a free trial today.
Changelog
If you want to follow the latest updates and upcoming features of akenza in real-time, be sure to check our changelog.


